
Experimental Physics and Industrial Control System
Kay,

More detail:
I reproducibly encounter this problem upon starting CSS and going
through the step to select the PV and time period. Note however that if
I keep poking away at things (raw vs. optimized, looking at samples,
...) it sometimes starts working!
Here is the tail of /tmp/archserver.log when it doesn't work (it seems
odd to me that the server runs twice for each request)
01/07/2011 15:22:08 ---- ArchiveServer 2.9.2 Started ----
01/07/2011 15:22:08 Client: Java/1.6.0_22 @ 128.84.45.174:3858
01/07/2011 15:22:08 archiver.info
01/07/2011 15:22:08 config: '/var/www/html/archive/cgi/serverconfig.xml'
01/07/2011 15:22:08 ArchiveServer ran 0.000773 seconds
01/07/2011 15:22:08 ---- ArchiveServer 2.9.2 Started ----
01/07/2011 15:22:08 Client: Java/1.6.0_22 @ 128.84.45.174:3859
01/07/2011 15:22:08 archiver.archives
01/07/2011 15:22:08 ArchiveServer ran 0.011069 seconds
01/07/2011 15:22:08 ---- ArchiveServer 2.9.2 Started ----
01/07/2011 15:22:08 Client: Java/1.6.0_22 @ 128.84.45.174:3860
01/07/2011 15:22:08 archiver.get_values
01/07/2011 15:22:08 how=3, count=800
01/07/2011 15:22:08 get_channel_data
01/07/2011 15:22:08 Method: Plot-Binning, 0.075 sec bins
01/07/2011 15:22:08 Start:  11/16/2010 20:45:00.000000000
01/07/2011 15:22:08 End  :  11/16/2010 20:46:00.000000000
01/07/2011 15:22:08 Open index, key 4613 = '/arch/data/l0/master_index'
01/07/2011 15:22:08 Handling 'LGTPMA01_power'
01/07/2011 15:22:08 570 values
01/07/2011 15:22:08 ArchiveServer ran 0.020456 seconds
01/07/2011 15:22:08 ---- ArchiveServer 2.9.2 Started ----
01/07/2011 15:22:08 Client: Java/1.6.0_22 @ 128.84.45.174:3861
01/07/2011 15:22:08 archiver.get_values
01/07/2011 15:22:08 how=3, count=800
01/07/2011 15:22:08 get_channel_data
01/07/2011 15:22:08 Method: Plot-Binning, 4.68437e-05 sec bins
01/07/2011 15:22:08 Start:  11/16/2010 20:45:59.962525000
01/07/2011 15:22:08 End  :  11/16/2010 20:46:00.000000000
01/07/2011 15:22:08 Open index, key 4613 = '/arch/data/l0/master_index'
01/07/2011 15:22:08 Handling 'LGTPMA01_power'
01/07/2011 15:22:08 1 values
01/07/2011 15:22:08 ArchiveServer ran 0.006347 seconds


Here is the tail of /tmp/archserver.log when it worked

01/07/2011 15:18:26 ---- ArchiveServer 2.9.2 Started ----
01/07/2011 15:18:26 Client: Java/1.6.0_22 @ 128.84.45.174:3836
01/07/2011 15:18:26 archiver.archives
01/07/2011 15:18:26 ArchiveServer ran 0.012326 seconds
01/07/2011 15:18:26 ---- ArchiveServer 2.9.2 Started ----
01/07/2011 15:18:26 Client: Java/1.6.0_22 @ 128.84.45.174:3837
01/07/2011 15:18:26 archiver.get_values
01/07/2011 15:18:26 how=3, count=800
01/07/2011 15:18:26 get_channel_data
01/07/2011 15:18:26 Method: Plot-Binning, 0.15 sec bins
01/07/2011 15:18:26 Start:  11/16/2010 20:44:00.000000000
01/07/2011 15:18:26 End  :  11/16/2010 20:46:00.000000000
01/07/2011 15:18:26 Open index, key 4613 = '/arch/data/l0/master_index'
01/07/2011 15:18:26 Handling 'LGTPMA01_power'
01/07/2011 15:18:26 1140 values
01/07/2011 15:18:26 ArchiveServer ran 0.041127 seconds
01/07/2011 15:18:26 ---- ArchiveServer 2.9.2 Started ----
01/07/2011 15:18:26 Client: Java/1.6.0_22 @ 128.84.45.174:3838
01/07/2011 15:18:26 archiver.get_values
01/07/2011 15:18:26 how=3, count=800
01/07/2011 15:18:26 get_channel_data
01/07/2011 15:18:26 Method: Plot-Binning, 4.68437e-05 sec bins
01/07/2011 15:18:26 Start:  11/16/2010 20:45:59.962525000
01/07/2011 15:18:26 End  :  11/16/2010 20:46:00.000000000
01/07/2011 15:18:26 Open index, key 4613 = '/arch/data/l0/master_index'
01/07/2011 15:18:26 Handling 'LGTPMA01_power'
01/07/2011 15:18:26 1 values
01/07/2011 15:18:26 ArchiveServer ran 0.0062 seconds
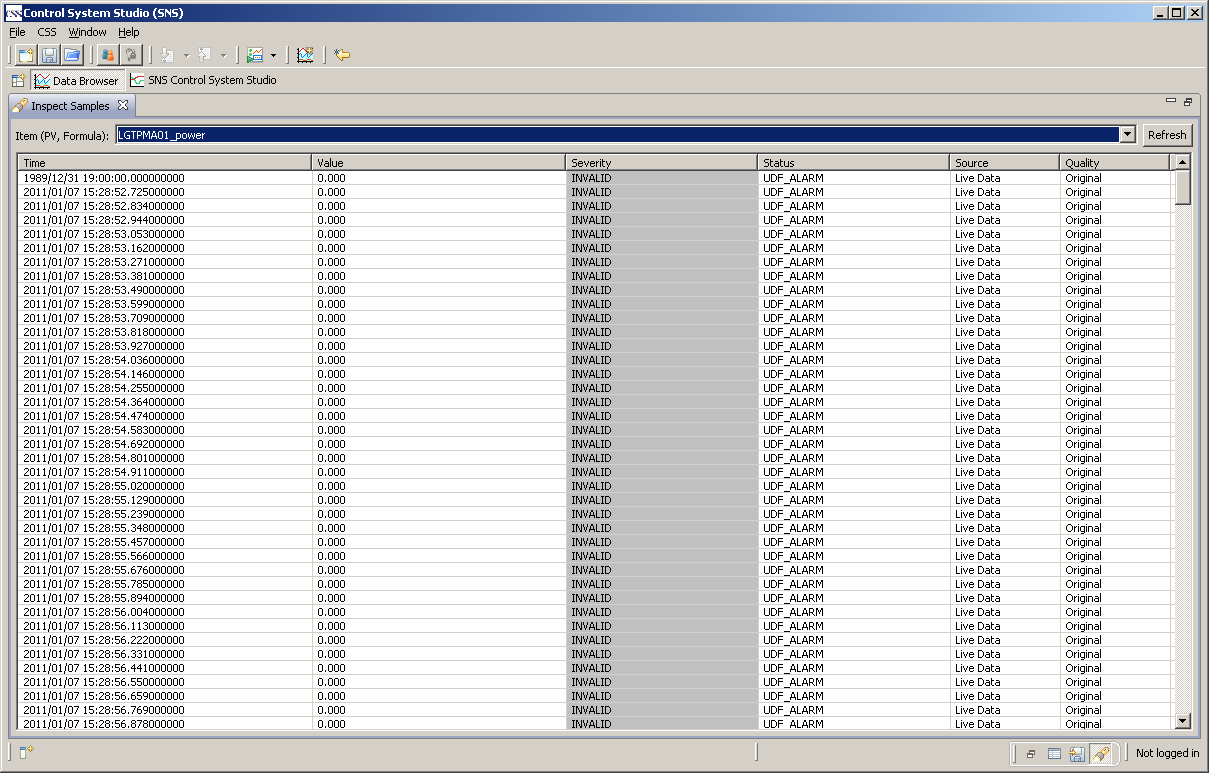
Attached as a PNG file is the Inspect Samples window when it doesn't
work. Note that the times do not match the requested time window.
The XML-RPC network data server version is:  perl-Frontier-RPC-0.07b4-1


John


On 1/7/2011 2:45 PM, Kasemir, Kay wrote:
Hi:

On 1/7/11 14:22 , "John Dobbins"<[email protected]>  wrote:
We have encountered a case in which CSS Data Browser does not
display a PV correctly. It can export the data (so has certainly
retrieved it from the Archiver).
Yes, but in different ways.
# Created by CSS Data Browser Version 2.0.5.20101112
#
# Start Time : 2010/11/16 20:45:00.000000000
# End Time   : 2010/11/16 20:46:00.000000000
# Source     : Optimized Archived Data
# Desired Value Count: 1000
The export process itself requested ~1000 samples between start&  end time.

The plot uses a desired value count that's configured in the under
preferences CSS/Apps/Trends/Data Browser, by default 800.

Check in the Sample view to see what data the plot actually has to determine
if the problem is in the data that the plot uses, or the plot itself.

If this is for the old Channel Archiver with the XML-RPC network data
server, you can also check the log file of the network data server
(/tmp/archserver.log) to compare
a) What the plot requests&  gets
b) What the export requests&  gets

I assume the reason lies in the way the data is requested, and how that's
handled by the XML-RPC network data server.
What version is your XML-RPC network data server?

Thanks,
Kay
Attachment:
cornell_inspect_samples.PNG
Description: PNG image
- Replies:
- Re: CSS Data Browser Plot Problem Kasemir, Kay
- References:
- Re: CSS Data Browser Plot Problem Kasemir, Kay
- Navigate by Date:
- Prev:
Re: CSS Data Browser Plot Problem Kasemir, Kay
- Next:
Re: CSS Data Browser Plot Problem John Dobbins
- Index:
1994
1995
1996
1997
1998
1999
2000
2001
2002
2003
2004
2005
2006
2007
2008
2009
2010
<2011>
2012
2013
2014
2015
2016
2017
2018
2019
2020
2021
2022
2023
2024
2025
- Navigate by Thread:
- Prev:
Re: CSS Data Browser Plot Problem Kasemir, Kay
- Next:
Re: CSS Data Browser Plot Problem Kasemir, Kay
- Index:
1994
1995
1996
1997
1998
1999
2000
2001
2002
2003
2004
2005
2006
2007
2008
2009
2010
<2011>
2012
2013
2014
2015
2016
2017
2018
2019
2020
2021
2022
2023
2024
2025