| 1994 1995 1996 1997 1998 1999 2000 2001 2002 2003 2004 2005 2006 2007 2008 2009 2010 2011 2012 2013 2014 2015 <2016> 2017 2018 2019 2020 2021 2022 2023 2024 | Index | 1994 1995 1996 1997 1998 1999 2000 2001 2002 2003 2004 2005 2006 2007 2008 2009 2010 2011 2012 2013 2014 2015 <2016> 2017 2018 2019 2020 2021 2022 2023 2024 |
| <== Date ==> | <== Thread ==> |
|---|
| Subject: | Question about CSS Data Browser plot |
| From: | lzf neu <[email protected]> |
| To: | "[email protected]" <[email protected]> |
| Date: | Thu, 29 Dec 2016 16:06:49 +0000 |
|
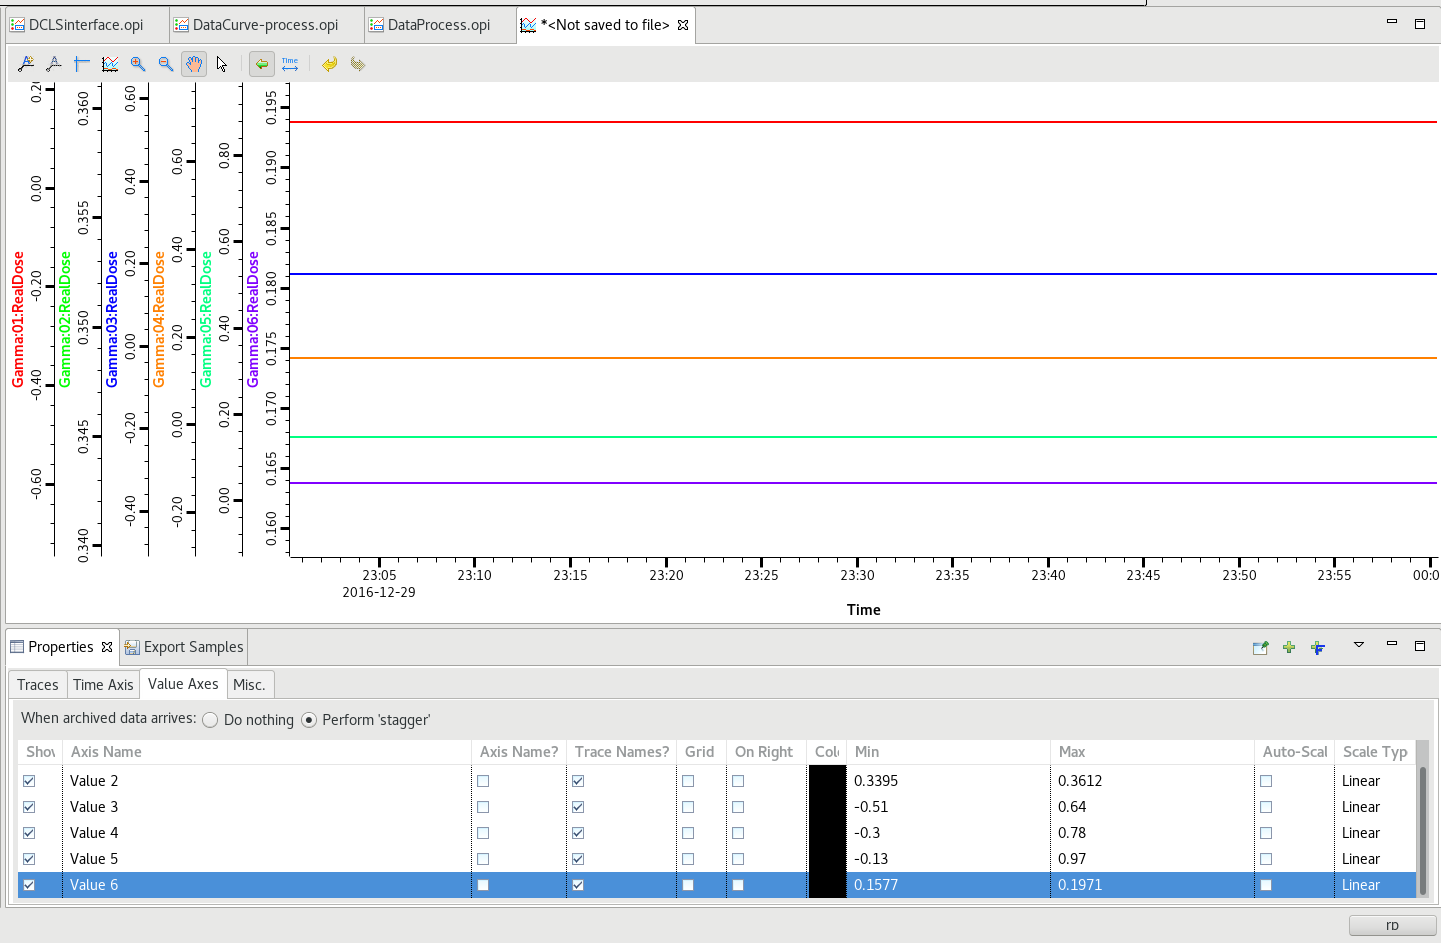
hi all,
When added pv name to Data Browser plot window, the plot line vs. time showed the right curve, but immediately changed into straight one which is not the right display. The line should
fluctuate vs time. The time span I set is 1 hour. If I increase the time span, the line is still a straight one.
however, the exported data is right from data browser plot and fluctuate vs time.
I wonder what is wrong with my settings. The operation system is fedora25-64bit and CSS is unzipped from
sns-css-4.1.1-linux.gtk.x86_64.zip.
I have attatched the plot in the attatchment. Thanks in advance.
|
Attachment:
aaa.png
Description: aaa.png