EPICS Home

Experimental Physics and Industrial Control System


1994  1995  1996  1997  1998  1999  2000  2001  2002  2003  2004  2005  2006  2007  2008  2009  2010  2011  2012  2013  2014  2015  2016  2017  <20182019  2020  2021  2022  2023  2024  Index 1994  1995  1996  1997  1998  1999  2000  2001  2002  2003  2004  2005  2006  2007  2008  2009  2010  2011  2012  2013  2014  2015  2016  2017  <20182019  2020  2021  2022  2023  2024 
<== Date ==> <== Thread ==>

Subject: xygraph annotation settings
From: "Amien Crombie (GMail)" <[email protected]>
To: EPICS Tech-Talk <[email protected]>
Date: Fri, 31 Aug 2018 09:52:28 +0200

Hi

I have the following python script:

#################################################################################

wid = display.getWidget("xgraph")
xyGraph = wid.getFigure().getXYGraph()

ZeroAnno = Annotation("", xyGraph.primaryXAxis, xyGraph.primaryYAxis)
ZeroAnno.setCursorLineStyle(Annotation.CursorLineStyle.UP_DOWN)
xyGraph.addAnnotation(ZeroAnno)

ZeroAnno.setValues(0, 3500)

########################################################

It works fine as my zero annotation below
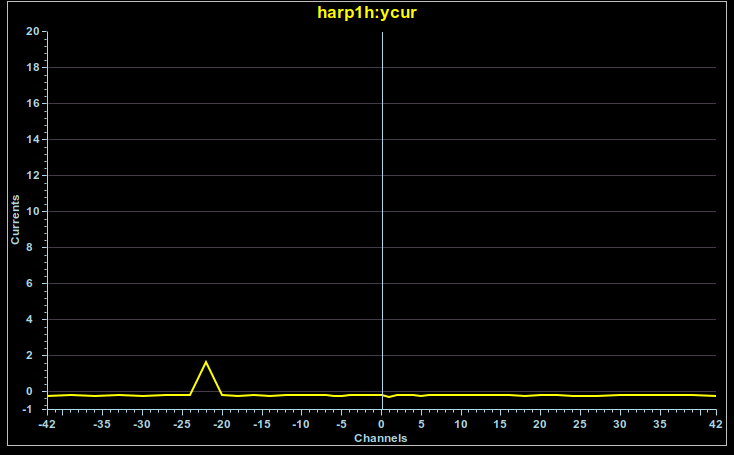

How can I set my annotation 'ZeroAnno' line color as well as the line thickness

Thanks

Amien


Navigate by Date:
Prev: Asyn: disconnect and reconnect port via PV Niedermayer, Philipp
Next: xygraph annotation setting Amien Crombie
Index: 1994  1995  1996  1997  1998  1999  2000  2001  2002  2003  2004  2005  2006  2007  2008  2009  2010  2011  2012  2013  2014  2015  2016  2017  <20182019  2020  2021  2022  2023  2024 
Navigate by Thread:
Prev: RE: Asyn: disconnect and reconnect port via PV Mark Rivers
Next: xygraph annotation setting Amien Crombie
Index: 1994  1995  1996  1997  1998  1999  2000  2001  2002  2003  2004  2005  2006  2007  2008  2009  2010  2011  2012  2013  2014  2015  2016  2017  <20182019  2020  2021  2022  2023  2024