by Ben-chin K Cha
The GUI is implemented through using Tkinter and Pmw. It can handle ASCII or MDA file. It will extract 1D multiple array from any ASCII text file as well as any MDA file. Extracting 1D array from MDA file is obtained by properly handling of the scan data object returned by the readMDA program.
The ASCII file can contain row or column oriented vectors. By default the column oriented vector array is assumed. If the data set is row oriented vector, a user can simply use the 'Row Oriented' entry from Setup menu to convert the row data into column data internally. Any line start with ';' or '#' will be treated as comment and ignored. The text data may or may not contain independent variable vector.
Zero based index sequence number is used in setting up array vectors. By default the first column (0) contains the X vector. The remaining columns starting from the second column (1) contain the dependent variable vectors. User can override the default setting by properly modifying the X or the starting Y sequence index fields.
A collection of sequenced check buttons will be created when the extracted 1D array is loaded in. The total number of check buttons reflects the total number of dependent variables or curves found in file. For each column vector there associates a checkbutton for it. By default only the first two curves are selected for plot a user can easily to change the selections by checkbutton or setup menu.
Please refer plot1d for functions and class methods defined in plot1d.py
| pviewer.zip | (0.126MB) | A collection of 1D/2D/3D graphic programs for python package |
Operation System libraries reguired:
        TK
        TCL
        GTK

Python sub-packages reguired:
        Tkinter
        Pmw
        Numeric
        PIL
        Pygtk
        matplotlib
	source /APSshare/setup_apsshare
	plot1d.py
The active plot window is the current plot window generated. and it can be easily closed by simply clicking the right mouse button. Closing of current active plot window results that the very last generated plot window becomes the current active plot window.
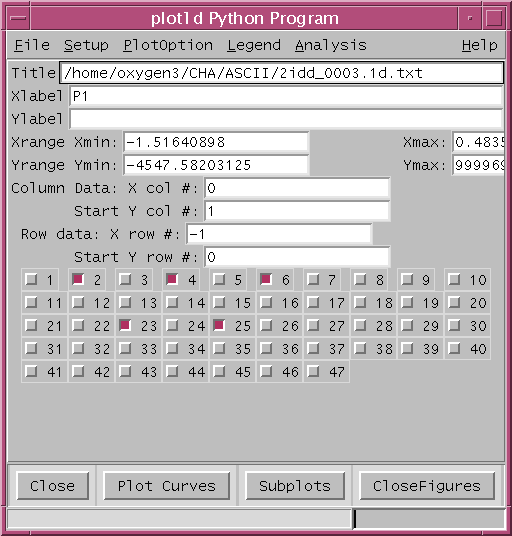
The main window consists of menu bar, a collection of control label input fields, a row of command buttons area, and a set of various popup dialogs. They are described below:
File Menu
Load Ascii Data... - use file selection dialog to pick a file, by default
it assumed column oriented data in ASCII file
Print Plot1d.jpg - created plot1d.jpg and send the color jpg file to a
PS printer through pilprinter.py program
Printer... - dialog to override the default PS printer
Quit - exit the plot1d program
Setup Menu
Display Ascii File... - display text contents of a picked ascii data file
to provide convenient varification of column or
row data array and plot curves
Row Oriented - treat ascii file as row oriented data array
Column Oriented - treat ascii file as column oriented data arrayy
(default this is assumed)
Select All Checkbutton - select all curve check buttons to be plotted
Select None Checkbutton - deselect all checked curve buttons
PlotOption Menu
Line Style On - checkbutton for using different line styles
Grid Line On - checkbutton for drawing grid line
Log Xaxis On - checkbutton for logarith X axis
Log Yaxis On - checkbutton for logarith Y axis
Symbol On - checkbutton whether to plot symbols with curve
Setup Symbol... - a dialog to modify the default curve symbols
Legend Menu
Legend On - checkbutton whether to plot legend or not
Default Legend Location - a collection of radiobutton to set default
legend location
User Legend Location... - a dialog to set the desired legend location
Setup Legend Labels... - a dialog to set the legend strings for plotting
Analysis Menu
Statisic ... - dialog to setup statistics calulation for desired curve
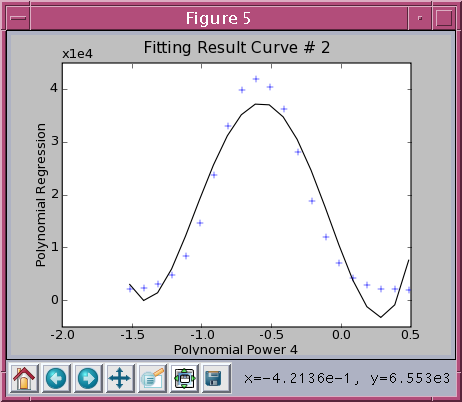
Fitting ... - dialog to setup polynomial fitting for desired curve
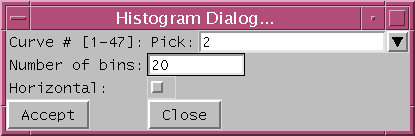
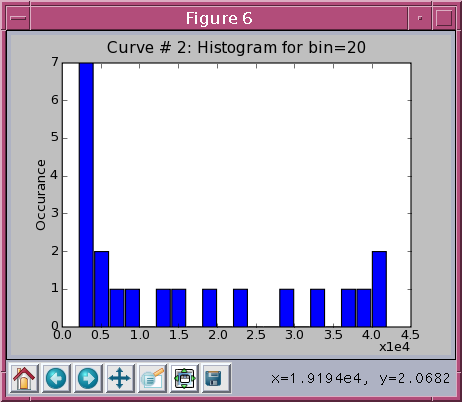
Histogram ... - dialog to setup histogram plot for desired curve
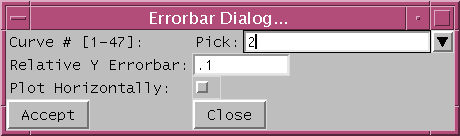
Errorbar ... - dialog to setup errorbar plot for desired curve
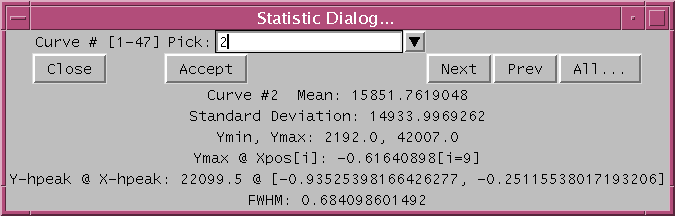
Statistic Dialog
Curve # to Pick: - droplist field to specify the picked curve number
Close - terminate the statistic dialog
Accept - calculate and update statistic info for picked curve
Next - calculate and update statistic info for next curve
Prev - calculate and update statistic info for previous curve
All... - calculate and display statistic for all data curves
Statistic Info - label area display statistic info of picked data curve
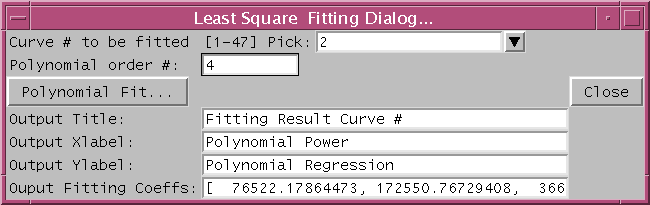
Polynomial Fitting Dialog
Curve # to be fitted: - droplist field to specify the curve number
Polynomial order #: - field to specify order of fitted polynomial
Ok Button - accept entry fields and performed fitting calculation
Close Button - terminate the fitting dialog
Output Title - field to specify the plot title for fitted result
Output Xlabel - field to specify the plot xlabel for fitted result
Output Ylabel - field to specify the plot ylabel for fitted result
Output Fitting Coeffs - field to display coeficients of fitted result
Help Menu
About ... - help about the progrm information
Balloon Help - checkbutton for balloon info about each menu and button
Help Info... - pops on line help about plot1d program
Curve Plot Control Label Widgets
Title - enter plot title and update current figure
Xlabel - enter new xlabel and updagte current figure
Ylabel - enter new ylabel and updagte current figure
Xrange: Xmin - enter X starting value for plot
Xrange: Xmax - enter X ending value for plot
Yrange: Ymin - enter Y starting value for plot
Yrange: Ymax - enter Y ending value for plot
X Column Seq# - specify the column seq # for X vector in data array
default 0 indicates first column contains X vector
use -1 to indicate file contains no X vector
X Row Seq# - specify the row seq # for X vector in data array
default -1 indicates file contains no X vector in file
Group of Curve Check Buttons
CheckButtons - collection of check buttons are created when an ASCII
file is loaded in, one button per defined curve
By default only first 2 curves are picked, a user can
configure the line plot by select/deselect any curve
as user prefered
Command Button Row
Close - close and exit the plot1d program
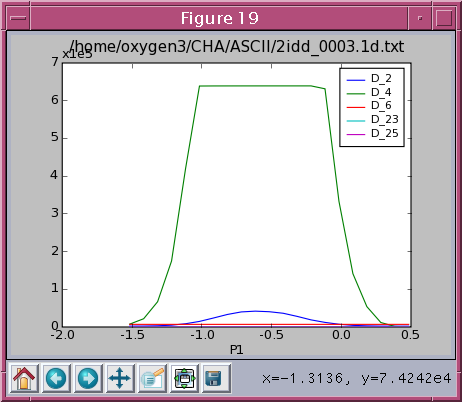
Plot Curves - plot checked column vectors with current control setting,
each time a new multi-line plot window is generated
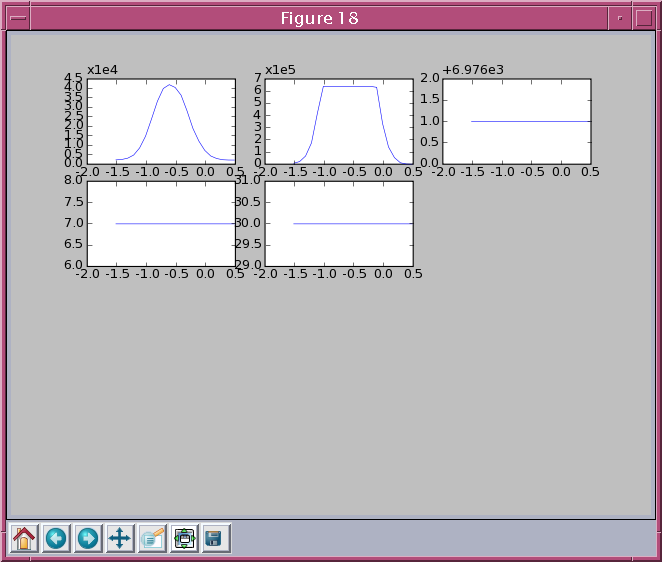
Subplots - plot checked column vectors as subplots, at most 9 subplots
can be drawn, each time a new subplot window is generated
CloseFigures - automatically close all plot/figure windows
The Title, Xlabel and Ylabel fields allows the user easily to modify the plot Title, X label and Y label for the current active plot window. For example, to change the plot title by typing the new string in the field and then followed by pressing the carriage return or 'Enter' key.
Please refer the text file plot1d_help.txt