by Ben-chin K Cha
It can extract 2D array from ASCII text file as well as from multiple 2D image arrays from MDA 2D/3D scan file.
The GUI is implemented through using Tkinter and Pmw. It can load any text file of 2D array data into plot2d whether the data contains row or column oriented vectors. Any line starting with ';' or '#' will be treated as comment and ignored. The text data may or may not contain independent variable vector. If the data set is row oriented vector, a user can simply use the 'Row Oriented' entry from Setup menu to convert the row data into column data internally.
The Title, Xlabel and Ylabel fields allows the user easily to modify the plot Title, X label and Y label for the current active plot window. To update the plot title by typing the new string in the field and followed by pressing the carriage return or 'Enter' key.
Please refer plot2d for functions and class object methods defined in plot2d.py.
| pviewer.zip | (0.126MB) | A collection of 1D/2D/3D graphic programs for python package |
Operation System libraries reguired:
        TK
        TCL
        GTK

Python sub-packages reguired:
        Tkinter
        Pmw
        Numeric
        PIL
        Pygtk
	matplotlib
	source /APSshare/setup_apsshare
	plot2d.py
plot2d.config - configuration file to remember the last MDA and TXT directories
                 used
*.txt         - contains row / column oriented 2D image data file
*.mda         - any 2D/3D MDA scan files which contains 2D image arrays
1.txt         - temporary text file to hold the row oriented 2D data array
                to pass to 3dgraph.py surface plot program
*.png         - various png file name can be used for storing various image
                or line plot
plot2d.jpg    - current figure saved to plot2d.jpg before sending to PS printer
At present the matplotlib can only save the plot as PNG file, and
the python program pilprinter.py can only print JPEG file.
Therefore on UNIX system the PS print job is automatically processed
like below:
        - first saved the plot as intermediate 'plot2d.png' file
        - then use PIL image save function to convert to 'plot2d.jpg'
        - then pass 'plot2d.jpg' to pilprinter.py
On WIN system the MicroSoft Photo Editor is used to show the image and
which let the user easily print the image plot.
Every menu item end with '...' indicates there is a new window asscociated with it. The active plot window can be easily closed by simply clicking the right mouse button (button 3). The active plot window is the current plot window generated. Closing of current active plot window results that the very last generated plot window becomes the current active plot window.
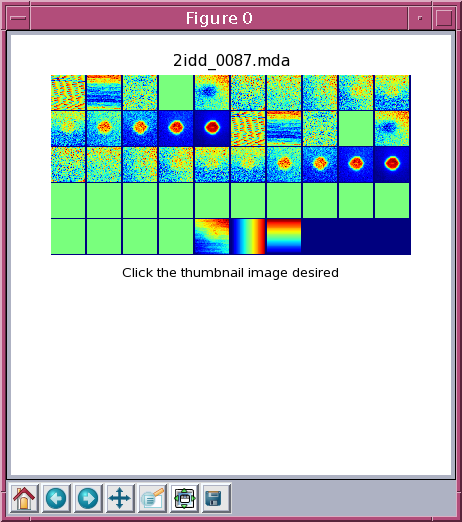
Figure 0 is reserved for panimage of 2D images found in 2D/3D MDA files. Each row contains 10 images/detectors and image figure is placed sequentially row by row starting from the top left corner. There are 2 button events asscociated with the panimage window:
        button 1  -  click the thumbnail image area to pop up the
                        desired detector 2D TV image
        button 3  -  close the panimage window (figure 0)
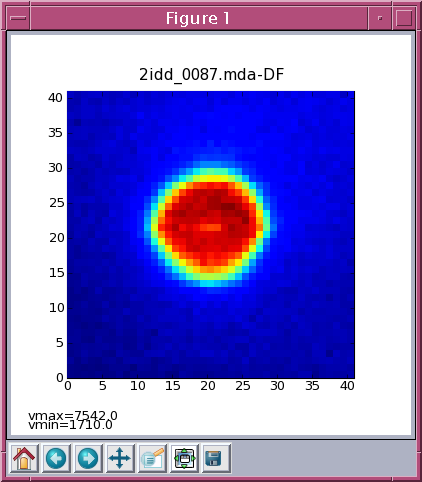
There are 3 click button events asscociated with each 2D TV image window:
        button 1  -  update the cursor values label in the main window
                        to reflect the X,Y,Value at the cursor location
        button 2  -  pop up the X-horizontal and Y-vertical line profile
                        windows cross at the cursor location
        button 3  -  close the current TV image window
Menu Bar - hold various program control menus
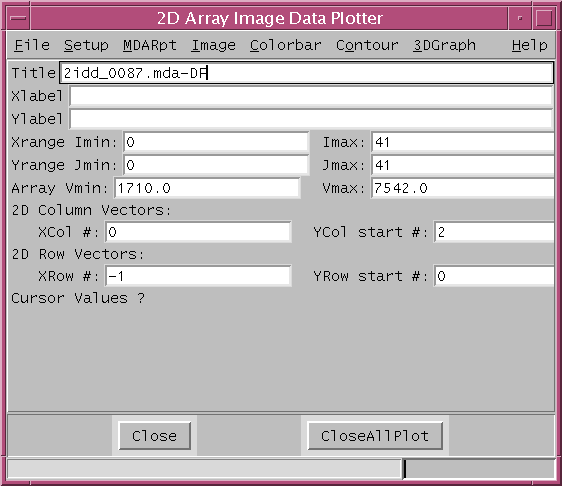
Plot Labels:
Title - fields used to modify plot title of current figure
Xlabel - fields used to modify plot xlabel of current figure
Ylabel - fields used to modify plot ylabel of current figure
X,Y,V Ranges:
Xrange Imin - image ROI X range start index #
Imax - image ROI X range end index #
Yrange Jmin - image ROI Y range start index #
Jmax - image ROI Y range end index #
Array Vmin - minimum of image array value
Vmax - maximum of image array value
2D Columns Data:
XCol vectore seq # - specify the zero based X column vector # in ascii
file, enter -1 if no X vector defined
YCol start seq # - specify the Y vectors start column seq number
2D Rows Data :
XRow vector seq # - specify the zero based X row vector # in ascii file,
enter -1 if no X vector deined
YRow start seq # - specify the Y vectors start column seq number
Cursor Values ? - label field to reflect the image values at the click of button 1
Command Button Area
Close - button close all windows and quit the plot2d program
CloseAllPlot - button automatically close all plot figures
	MDA 2D/3D Files...    - file selection dialog to extract 2D images out of
       	                 	any 2D/2D MDA files and pop up a panimage plot window
	ASCII 2D Data...      - file selection dialog to open row/column oriented
                        	image data array and pop up TV image plot window
	Picture Files...      - dialog to start the subprogram Scrapbook from tv.py to
                        	view any picture file
	Print plot2d.jpg      - create plot2d.jpb from the current figure and send
                        	it to PS printer
	Printer...            - dialog to override the default PS printer
	Quit                  - close and exit plot2d.py program
	Show MDA 2D Images    - redraw the panimage Figure 0 if 2D/3D MDA file been
				currently loaded in
	Display Ascii File... - display the ascii text file currently loaded in
	Caption On            - checkbutton for plot caption on/off, default on
	Set X,Y Data Ranges   - set actual X,Y coordinate data ranges for ascii file
	Data Column Oriented  - checkbutton for column vectors ascii file,
				default column oriented true
	2D Report          - generate 2D image report for each defined detector
	2D IGOR Report     - generate 2D image report for IGOR format
	Report2D->1D       - generate seperate 1D report from 2D arrays
	2D Report(stepwise/row oriented) - generate 2D image report for each defined
				detector in stepwise order as row vector
	Report All         - generate all ascii report from the selected MDA directory
	View Ascii File... - dialog to pick and display the Ascii file
	Delete ASCII/*.txt File... - dialog to remove *.txt from ASCII directory
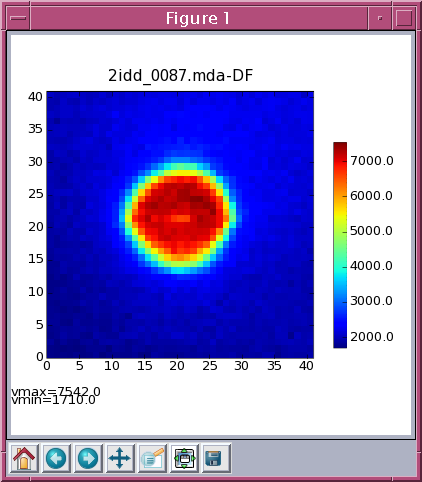
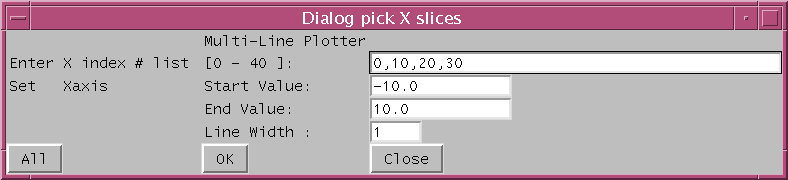
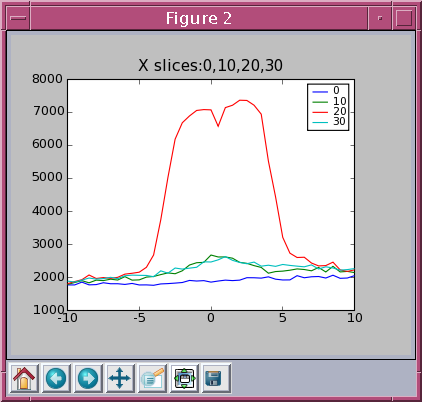
	TV Image...             - redraw ascii image connected with click event
		  		(cross line profiles at clicked cursor point)
	Image Smoothing...      - dialog to select smoothing method for TV image
	Image Color Limits...   - dialog to set TV image color limit scheme
	Rainbow + peak White... - display TV use private color map rainbow+white with
			  	colorbar also drawn
	Plot X Slices...        - dialog to pick X slices for vertical line profile
	Plot Y Slices...        - dialog to pick Y slices for horizontal line profile
	Image Transposed        - transposed TV image
	Image Flip Horizontally - flip TV image horisontally
	Image Flip Vertically   - flip TV image vertically

		Plot X Slices Dialog

	Enter X index # list    - enter comma seperated vertical linecut # list
	Set Xaxis Start Value  - set line plot axis Ymin
	Set Xaxis End Value    - set line plot axis Ymax
	All                     - button to plot all rows
	OK                      - accept row # list, and plot selected rows

		Plot Y Slices Dialog

	Enter Y index # list    - enter comma seperated horizontal linecut # list
	Set Xaxis Start Value  - set line plot axis Xmin
	Set Xaxis End Value    - set line plot axis Xmax
	All                     - button to plot all columns
	OK                      - accept column # list, and plot selected columns
	Reset Color Map...      - dialog to change to other predefined color map
	With Colorbar...        - also draw colorbar with the TV image
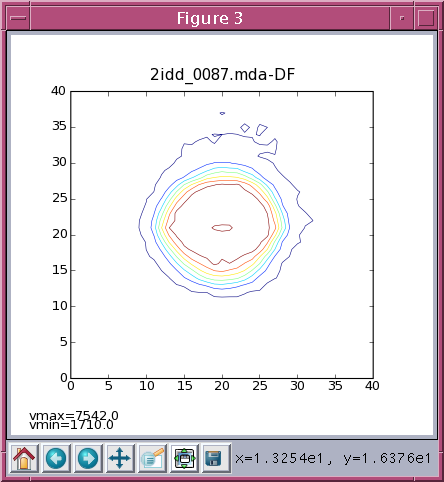
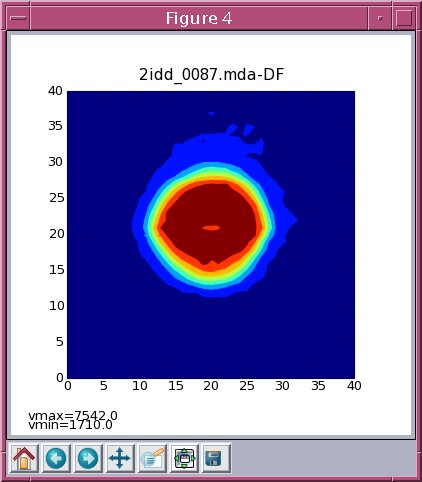
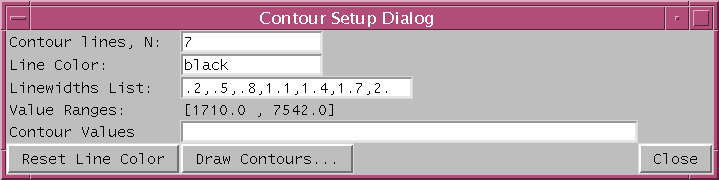
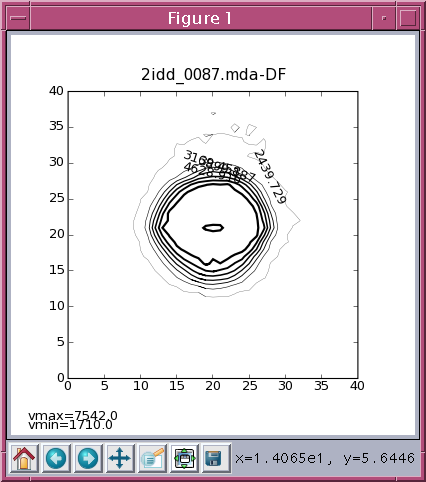
	Contour...         - colored contour line plot
	Contour Filled...  - colored filled contour plot
	Contour Setup...   - contour parameters setup dialog

		Contour Setup Dialog

	Contour lines   - field specify number of contour lines, default 7
	Line Color      - string field specify color name, default 'black'
	Linewidths list - field specify line widths, default .2,.5,.8,1.1,1.4,1.7,2.
	Value Ranges    - label widget to display min and max data range
	Contour Values  - field specify comma sperated contour values, value field
		  	  entry overrides the line field specification
	Reset Line Color - pop up list of predefined color can be used
	Draw Contours... - accept all settings and re-draw contour figure
	Close            - close and exit contour setup dialog
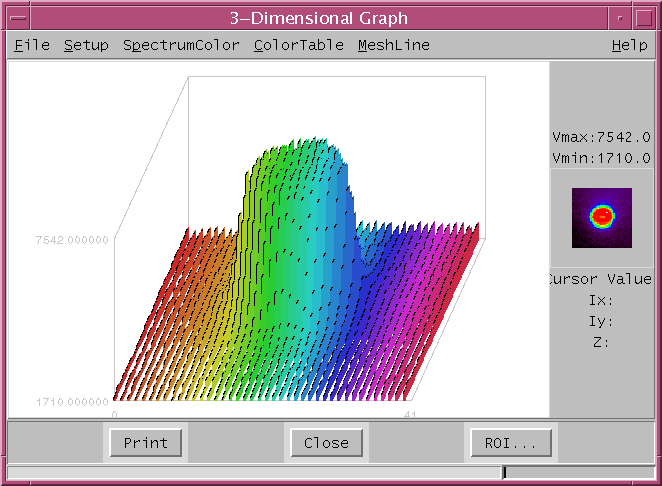
	3DGraph...  - pass the image data through 1.txt and invoke the 3D
			surface plot prgram 3dgraph.py
	About...        - pop up about 2D Array Image Data Plotter
	Balloon Help    - chechbutton for balloon help message
	Help Info...    - pop up this on-line help info about plot2d.py