Ben-chin K Cha
Timothy Mooney
Maintained by Ben-chin Cha ([email protected])
The complete package consists of following python modules:
    MDA data process: 	readMDA.py
			mdaAscii.py
			plot.py

    Image process: 	view2d.py
			imageUtil.py
			tv.py

    Line plot program: 	plotAscii.py
			graph.py

    Pviewer package: 	pviewer.py
			AppShell.py
			ProgressBar.py

    matplotlib package: plot1d.py
     			plot2d.py
     			fit.py

    3D graphic package: 3dgraph.py
			viewCT.py
The original readMDA.py is implemented by Tim Mooney and it provides the MDA reader routine to extract scan data from MDA files. Please refer the Functions section in readMDA.html for available routines defined in this module. The original version of mdaAscii.py is obtained from Tim Mooney, it had been extensively modified and now it supports various types of 1D/2D report generations. Please refer the Functions section in mdaAscii.html for available routines defined in this module. The plot.py is implemented by Tim Mooney which is able to display any 4 detector array from the current scan record specified by user. Please refer the python applications for beamline control implemented by Tim Mooney for details.
The multi-line plot package plotAscii.py is based on the graph classes from graph.py which is extracted and modified from Grayson's book. It accepts Ascii text file on the command line, and also provides simple widgets to let user easily tailor the final multi-line plot. Please refer the Functions section in plotAscii.html for available routines defined in this module.
The 2D image features in imageUtil.py and view2d.py are developed based on the Image classes from the Python Image Library. It provides easy to use routines to display scientific data or any picture files. Please refer the Functions section in imageUtil.html and view2d.html for examples on image processing routines.
On top of common shared routines, the pviewer is designed with the goal that it provide flexible user interface to access ASCII/MDA data and display 1D/2D data graphically. It also provide convenient menu to access any system command and to access IDLVM scan tools like scanSee / catcher / mca supported by BCDA.
The GUI in pviewer.py is implemented based on the basic classes AppShell and ProgressBar developped by John E. Grayson from the book of Python and Tkinter Programming (Ref.1). It integrates the multi-line plots, image processing, MDA reader, MDA report generation all into one system. So user can access and display any 1D/2D data array from ASCII or MDA files.
The GUI tv.py program can display any picture file or display any real ASCII 2D data array as image with a set of user selectable color tables. It is built from the imageUtil.py and the scrapbook class extracted and modified from Grayson's book. Please refer tv.html for more information about this program.
Currently the complete set of programs had been successfully tested on both UNIX, LINUX and WIN system.
	Tkinter - Tk interface library
	Pmw - python mega widget library
	PIL - python image library
	Numeric  - python numeric package
source ~cha/setup_pythonThe contents of ~cha/setup_python is given below:
  setenv PYTHONSTARTUP /home/oxygen/CHA/epics/extensions/lang/python
  setenv PYTHONPATH .:/opt/local/lib:/home/oxygen/CHA/epics/extensions/lang/python:/home/oxygen/CHA/epics/extensions/lib/solaris-sparc
  set path=(~cha/epics/extensions/bin/solaris-sparc ~cha/epics/extensions/lang/python $path)
pythonNormally exit python program by entering CNTL-D at the python prompt >>>. Python session may also be aborted by entering CNTL-\ at the python prompt >>> in this case a core file will be created.
	from readMDA import *
	d = pickMDA()
	from readMDA import *
	d = readMDA('/home/beams/CHA/data/xxx/cha_0001.mda')
	mdaAscii_1D - generate report from multi-detector 1D array
	mdaAscii_2D - generate seperate 2D report for each defined detector
 	mdaAscii_2D1D - generate 1D report from multi-detector 2D image array
	mdaAscii_IGOR - generate all detector 2D images in a single IGOR file
	mdaAscii_all - automatically generate 1D/2D ascii reports for each mda
		       file from the specified mda data directory path
Please refer the Functions section in mdatAscii.html for informaion of routine command syntax.
For an example of generating separate 2D ASCII image report for every defined detector found in a 2D/3D MDA scan file.
	from mdaAscii import *
	d = readMDA(filename)
	fn = mdaAscii_2D(d)
For an example of generating 2D images of all defined detectors found in a 2D/3D MDA scan file as a single IGOR file.
	from mdaAscii import *
	d = readMDA(filename)
	fn = mdaAscii_IGOR(d)
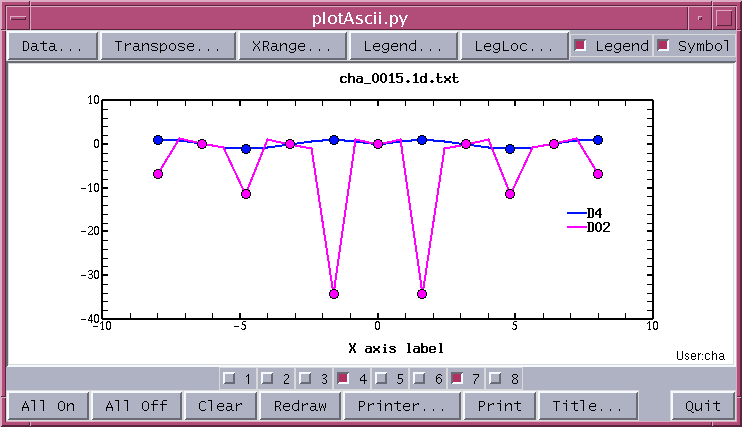
plotAscii.py ASCII/cha_0015.1d.txt 0For the case there is no X column defined in the text file -1 instead of 0 should be used. The plotAscii.py is a GUI program, by default it plots the first two curves. After modify the plot by Symbol, Legend, Toggle buttons, and Title... widgets, the final plot is show below.
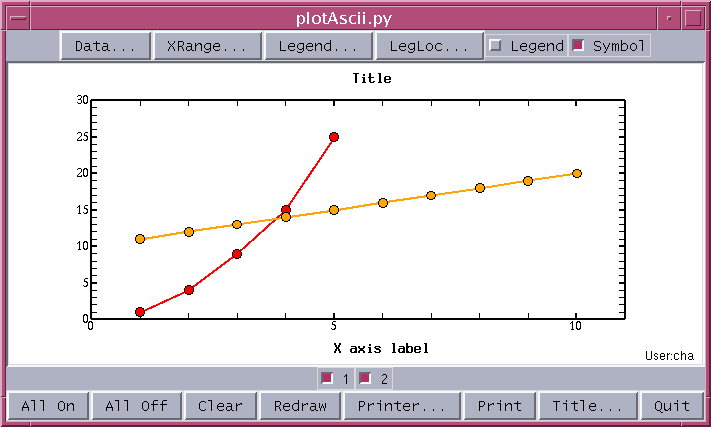
# pts.txt Example of row oriented scattering text data
# line 1
1. 2. 3.  4.  5.
1. 4. 9. 15. 25.
# line 2
 1.  2.  3.  4.  5.  6.  7.  8.  9. 10.
11. 12. 13. 14. 15. 16. 17. 18. 19. 20.
To pass 'pts.txt' to plotAscii.py on the Unix system:
plotAscii.py pts.txtThe plot result with symbol is given below:
	SH 	       - shared dictionary use to set printer, X column, etc
	pvs            - shared text file holds the list of legends
	*.txt	       - any 1D/2D text data file
	Data...         - scroll text window to display data columns
	Transpose...    - transpose row data into column data and saved in '1.txt'
			  and submit a new plotAscii.py with the transposed file
	Legend...       - dialog to modify legend for data column
	LegendLoc...    - dialog to set relative legend location on plot
	XRange...       - dialog to set X range of start/end points for plot
	Symbol          - check button for plot symbol on or off
	Legend          - check button for plot legend on or off
	Graph		- plot drawing area
	CB group	- check buttons for marking plotted curves
	All On          - plot all curves
	All Off         - none curve selected
	Clear           - Clear plot area
	Redraw          - redraw the plot area
	Printer...      - dialog to set printer
	Print		- send the plot to printer
	Title...        - dialog to change plot title, xtitle
	Quit            - exit the plotAscii program
	from imageUtil import *
	ct = readCT(i)		# i specify color table sequence number
The list of color table defined in CT is given below:
	Seq#	Color Table Description
	-----------------------------------
	 0 	B-W LINEAR
	 1 	BLUE/WHITE
	 2 	GRN-RED-BLU-WHT
         3 	RED TEMPERATURE
	 4 	BLUE/GREEN/RED/YELLOW
	 5 	STD GAMMA-II
         6 	PRISM
	 7 	RED-PURPLE
	 8 	GREEN/WHITE LINEAR
         9 	GRN/WHT EXPONENTIAL
	10 	GREEN-PINK
	11 	BLUE-RED
        12 	16-LEVEL
	13      RAINBOW
	14      STEPS
        15 	STERN SPECIAL
	16 	Haze
	17 	Blue-Pastel-Red
        18 	Pastels
	19 	Hue Sat Lightness1
	20      Hue Sat Lightness2
        21 	Hue Sat Value 1
	22      Hue Sat Value 2
	23 	Purple-Red + Stripes
        24 	Beach
	25 	Mac Style
	26 	Eos A
        27 	Eos B
	28 	Hardcandy
	29 	Nature
        30 	Ocean
	31 	Peppermint
	32 	Plasma
        33 	Blue-Red
	34 	Rainbow
        35 	Blue Waves
	36      Volcano
	37 	Waves
        38 	Rainbow18
	39 	Rainbow + white
	40 	Rainbow + black
At the end of readCT(), the temporary file 'pal.dat' will be
updated to hold the current color table picked by user. The image data
displayed will be scaled with the color table picked by user.
from plotAscii import readArray
from imageUtil import *
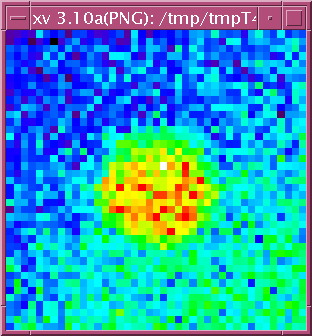
ct = readCT() # load rainbow+white color table
da = readArray('ASCII/2idd_0087.D12.txt')
im = display2D(da,1)
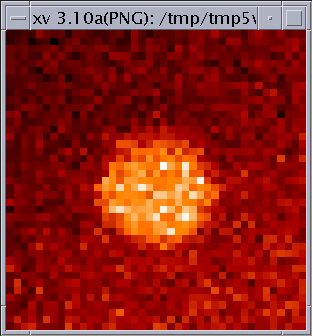
	ct = readCT(3)		# load red temperature color table
 	im = display2D(da,1)
Example of extracting a 2D image from an MDA 2D scan file.
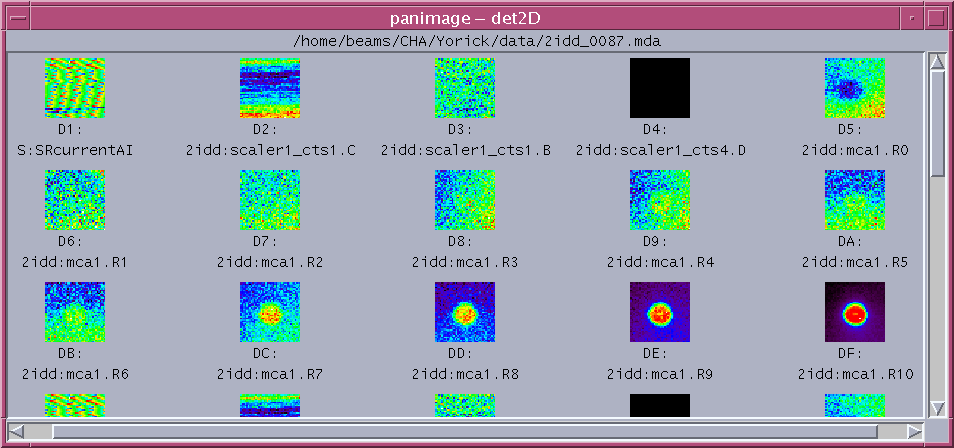
	from view2d import *
	file ='/home/beams/CHA/Yorick/data/2idd_0087.mda'
	ct = readCT()		# load the rainbow+white(40th) color table
				# ct = readCT(0) load black/white color table
	d = panMDA(file)	# readMDA and pan all images
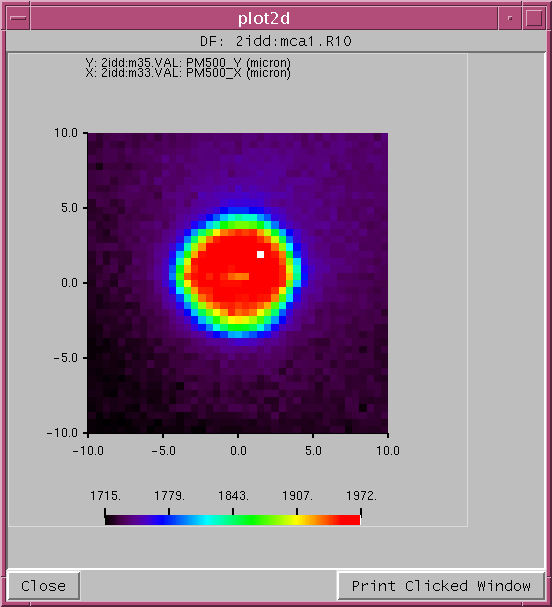
	from view2d import *
	file ='/home/beams/CHA/Yorick/data/2idd_0087.mda'
	d = readMDA(file)
	pick2d(d,14,updown=1)		# plot the 15th image upside down
To access the python program pviewer.py on the Unix system, at Unix prompt just enter
pviewer.py
	pviewer.config - configuration file saved for easy restart
	SH 	       - shared dictionary use by pviewer package
	CT	       - master array for 41 color tables
	pal.dat	       - extracted current color table
	pvs            - text file holds list of legends for multi-line plot
	*.ppm,*gif,*png- various intermediate image files created
	*.txt          - various text file created by report menu
	*.mda          - IOC autosaved MDA scan files
The report generation features will create various type of 1D/2D reports under the sub-directory ASCII in the current working directory. User must have the write permission at the startup directory in order to be able to run this program.
Various dialogs for setting X,Y range or name legend are available for freely tailoring the graphic output.
File Menu
Quit Save 'pviewer.config' file and exit the pviewer application
Printer... Dialog to set up printer and update shared file SH
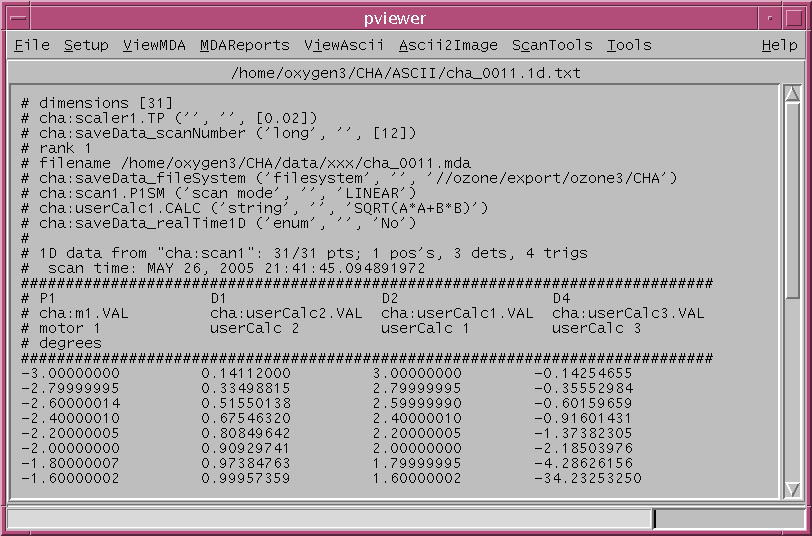
Open Ascii... Select the desired ASCII file and display the text
content in the scrolled main window
Open MDA... Select the desired MDA file and display the defined
detectors info in the main scrolled window
Setup Munu
Color Table... Dialog to display and select the desired color table,
default is item 39 Rainbow + white, temporary file
'pal.dat' is used to store the selected color table
Name Legend... Dialog to modify the legend name to be used in
multi-line plot.
Image Upside Down Checkbutton to plot image upside down
MDAView Menu
Multi-line 1D Plot... Display MDA 1D report in main scrolled text window
area and pass it to 'plotAscii.py' sub-program
PanImages... Pass MDA 2D image array to panimage plotter
Pick Di Image... Dialog to pick detector and pass image to plot2d routine
MDAReports Menu
MDA 1D/2D Report... Generate MDA 1D/2D Ascii reports according to defined scan
and detectors and display the last generated file in the
main scrolled text window
MDA 2D->1D Report... Generate sequential MDA 1D Ascii report from 2D data array
and display the last generated file in the main
scrolled text window
Generate All Report... Generate all 1D/2D reports for every MDA file found in the
current MDA data directory
MDA to IGOR Report... Generate MDA 2D image report in IGOR format and display
the file in main scrolled text window
View ASCII Report... Dialog to select report file and pop up text window to
display selected Ascii file
Remove All Report... Dialog to remove all text file from current ASCII directory
AsciiView Menu
Multi-line Plotter.. Pass the Ascii data to multi-line plot program
plotAscii.py
Extract & Modify Legend... Dialog to extract legend from comment line if
defined in Ascii file
TV Image ... Display data as 300x300 colored scaled TV image
Ascii2Image Menu
Plot2D... Pass 2D data directly to plot2d program
X,Y Range for image... Dialog set X,Y range and pass X,Y,Data to
plot2d program
X,Y Line vector from mdaAscii file...
Extracted X,Y vector from comment lines
from image text file generated by pviewer
and pass X,Y,Data to plot2d program
Extract X,Y,DATA from scanSee Ascii file...
Extract X column, Y row, Data row & column
from scanSee/catcher/yviewer generated image
file and pass X,Y,Data to plot2d program
ScanTools Menu
Python plot.py ... Run python program plot.py implemented by Tim Mooney
idlvm sscan ... Run scanSee program for IDLVM 6.0
idlvm catcher ... Run catcher program for IDLVM 6.0
idlvm mca ... Run MCA program for IDLVM 6.0
Tools Menu
start_epics ... Run the start_epics script
Command Dialog... Dialog for entering any valid system command or tools
Help Menu
About... Show pviewer program info
Balloon Help Toggle balloon help on or off
pviewer_help.txt... Show this on-line help message
Message Bar Area:
Balloon Message Area
Progress Bar Area
tv.py
	SH 	       - shared dictionary use by pviewer package
	CT	       - master array for 41 color tables
	pal.dat	       - extracted current color table
	*.ppm,*gif,*png- various intermediate image files created
	*.txt          - various text file created by report menu
File Menu
Open Ascii Data... - dialog to select 2D data file and display
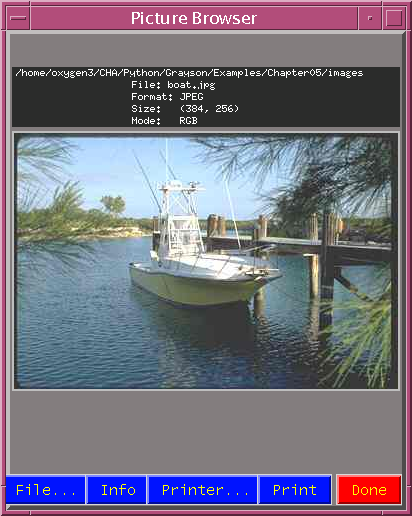
Picture Files... - pop up picture browser dialog
Printer... - dialog to override default printer
Print - send image to PS printer
Close - exit the program
Setup Menu
Test indgen([30,20]) - display test data indgen([30,20]) as image
Color Table... - dialog to change color table to be used
Transpose Data Array - display the transposed data array
Flip image Upside/Down - flip and display image upside/down
Flip image Left/Right - flip and display image left/right
Help Menu
About... - pop up program info
Booloon help - check button for booloon help
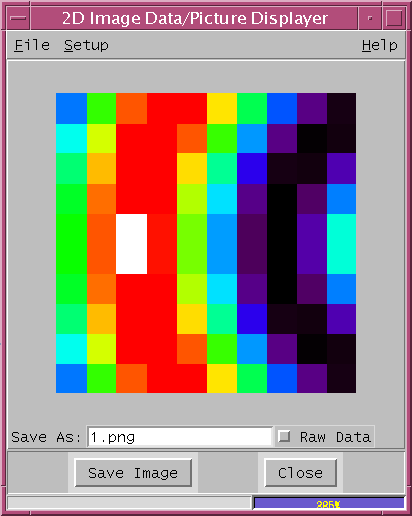
Drawing Area - 300x300 pixel image display area
Save As: 1.png - field to specify the output picture file name to be saved,
default 1.png
Raw Data - check button display image as raw data size,
default 300x300 pixels
Command Area:
Save Image - save the image to the output picture file
Close - exit the program
Message Bar Area:
Booloon Message Area
Progress Bar Area
Please refer the tv.html for more information about tv.py.