| 1994 1995 1996 1997 1998 1999 2000 2001 2002 2003 2004 2005 2006 2007 2008 2009 2010 2011 2012 2013 2014 2015 2016 2017 <2018> 2019 2020 2021 2022 2023 2024 2025 | Index | 1994 1995 1996 1997 1998 1999 2000 2001 2002 2003 2004 2005 2006 2007 2008 2009 2010 2011 2012 2013 2014 2015 2016 2017 <2018> 2019 2020 2021 2022 2023 2024 2025 |
| <== Date ==> | <== Thread ==> |
|---|
| Subject: | xygraph annotation setting |
| From: | Amien Crombie <[email protected]> |
| To: | EPICS Tech-Talk <[email protected]> |
| Date: | Fri, 31 Aug 2018 10:00:29 +0200 |
|
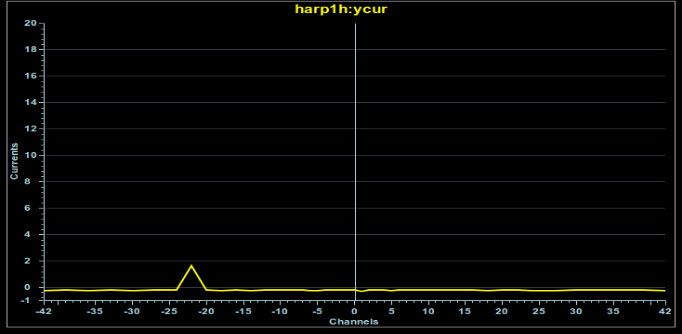
Hi I have the following python script: ################################################################################# wid = display.getWidget("xgraph") ZeroAnno.setValues(0, 3500) ######################################################## It works fine as my zero annotation below
How can I set my annotation 'ZeroAnno' line color as well as the line thickness Thanks Amien
|