Experimental Physics and
Industrial Control System
| 1994 1995 1996 1997 1998 1999 2000 2001 2002 2003 2004 2005 2006 2007 2008 2009 2010 2011 2012 2013 2014 2015 2016 2017 2018 2019 2020 2021 <2022> 2023 2024 2025 2026 | Index | 1994 1995 1996 1997 1998 1999 2000 2001 2002 2003 2004 2005 2006 2007 2008 2009 2010 2011 2012 2013 2014 2015 2016 2017 2018 2019 2020 2021 <2022> 2023 2024 2025 2026 |
| <== Date ==> | <== Thread ==> |
|---|
| Subject: | Re: [EXTERNAL] 1D Histogram in Phoebus |
| From: | "Kasemir, Kay via Tech-talk" <[email protected]> |
| To: | "[email protected]" <[email protected]>, Florian Feldbauer <[email protected]> |
| Date: | Mon, 26 Sep 2022 14:21:17 +0000 |
|
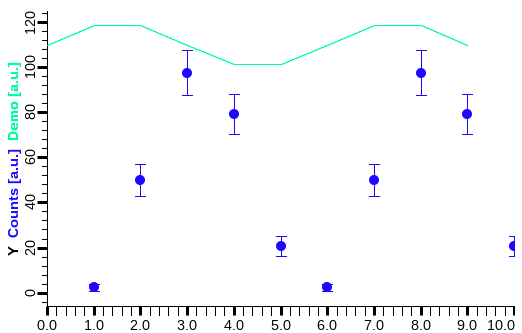
> widget that could be used to display a 1D histogram.
A 1D histogram tends to be a waveform, which can be displayed with the XYPlot widget as a line, point (with optional error bars) or bar chart:
  |
- Replies:
- Re: [EXTERNAL] 1D Histogram in Phoebus Florian Feldbauer via Tech-talk
- References:
- 1D Histogram in Phoebus Florian Feldbauer via Tech-talk
- Navigate by Date:
- Prev: 1D Histogram in Phoebus Florian Feldbauer via Tech-talk
- Next: Re: How to archive PVs regularly even if they are not updating Ralph Lange via Tech-talk
- Index: 1994 1995 1996 1997 1998 1999 2000 2001 2002 2003 2004 2005 2006 2007 2008 2009 2010 2011 2012 2013 2014 2015 2016 2017 2018 2019 2020 2021 <2022> 2023 2024 2025 2026
- Navigate by Thread:
- Prev: 1D Histogram in Phoebus Florian Feldbauer via Tech-talk
- Next: Re: [EXTERNAL] 1D Histogram in Phoebus Florian Feldbauer via Tech-talk
- Index: 1994 1995 1996 1997 1998 1999 2000 2001 2002 2003 2004 2005 2006 2007 2008 2009 2010 2011 2012 2013 2014 2015 2016 2017 2018 2019 2020 2021 <2022> 2023 2024 2025 2026
· Distributions · Download · Documents · Links · Licensing ·