Experimental Physics and
Industrial Control System
| 1994 1995 1996 1997 1998 1999 2000 2001 2002 2003 2004 2005 2006 2007 2008 2009 2010 2011 <2012> 2013 2014 2015 2016 2017 2018 2019 2020 2021 2022 2023 2024 2025 2026 | Index | 1994 1995 1996 1997 1998 1999 2000 2001 2002 2003 2004 2005 2006 2007 2008 2009 2010 2011 <2012> 2013 2014 2015 2016 2017 2018 2019 2020 2021 2022 2023 2024 2025 2026 |
| <== Date ==> | <== Thread ==> |
|---|
| Subject: | DataBrowser "Optimized" data Re: Inspect Samples of CSS shows inconsistent SEVR |
| From: | "Kasemir, Kay" <[email protected]> |
| To: | Burkhard Kolb <[email protected]> |
| Cc: | "[email protected]" <[email protected]> |
| Date: | Wed, 4 Apr 2012 10:57:47 -0400 |
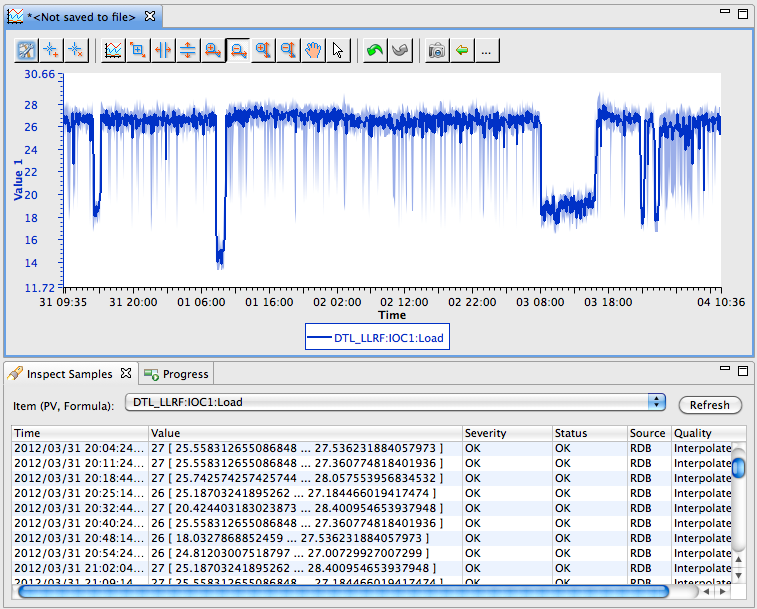
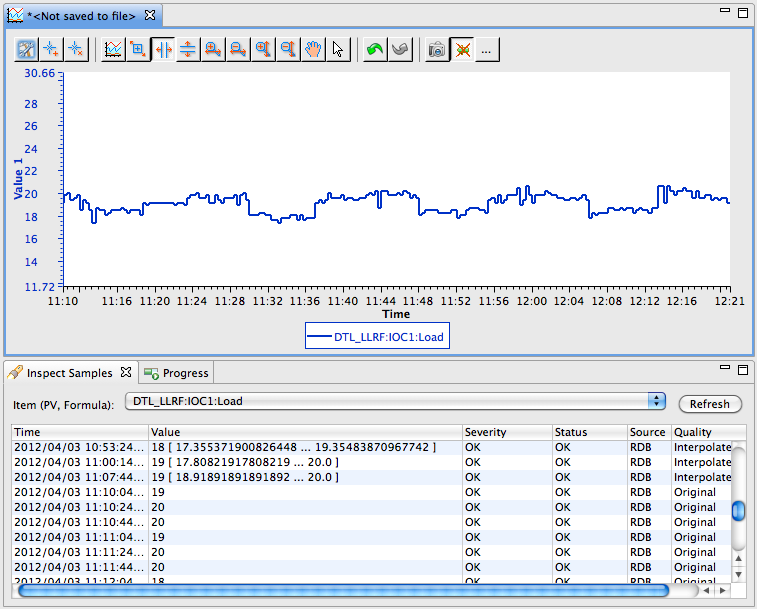
On 4/4/12 09:57 , "Burkhard Kolb" <[email protected]> wrote:
>Am 04.04.2012 um 15:49 schrieb Kasemir, Kay:
>>If you zoom in far enough and your data source then automatically
>> switches to raw data, you see that.
>This would be cool - how far is enough? I have now about 5 samples in
>time on the trend plot,
>nevertheless the Inspect Samples shows me many thousand samples and does
>not automatically switch
>to raw data.

There are two things happening here:
1) The data source determines how it provides the "optimized" data
2) The data browser merges that with what it already has in memory

Attached are screenshots taken with an RDB (Oracle, stored procedure) as
the data source, all using the "optimized" request.

In the first snapshot, I look at a few days of data. The data source
returns "interpolated" samples, specifically the min/max/average for about
800 bins across the requested time range.
800 can be adjusted in the preferences.

The plot shows the average as a line, the min/max as a shaded outline.
The sample inspector shows the interpolated values as "average [min ...
max]".

When I zoom in far enough, meaning: The data source determines that there
are fewer than 800 samples in the time range, so I it can simply return
the raw data, no need to optimize, we see the raw data: Only a line in the
plot, no min/max outline, and the sample inspector also shows "Original".

.. for the time range of the plot.
The Data Browser still has the interpolated samples for the bigger time
range in memory, like for the time before 11:10:04 in the snapshot.
Somewhat like this:

Interpolated data I I I I I Raw Data r r r r r r I I I I I I I

That way, if you "zoom out" again, it can right away plot what it has, so
you see _something_ while it requests updated data from the data server.


This is for the RDB-based archive where we've invested the last couple of
years of development.
The channel archiver's data server doesn't understand min/max/avg samples.
It returns a stream of initial/min/max/final samples where you can't tell
which one is which,
so no 'outline' is displayed.
It may also not do such a good job when it comes to automatically falling
back to 'original' data.
I had to give up development of the Channel Archiver because the
maintenance of its binary data
and index files simply went out of hand for us at the SNS. We use a
relational database for the
data storage since 2009.
Still, several sites have expressed interest in continuing to extend the
Channel Archiver:
64bit data format, ... and asked for the sources to be opened up, so
they've been on SourceForge
for a couple of years. Maybe somebody wants to update the network data
server's optimization
code?


The other thing that can happen is in the merging of newly received data
with existing in-memory data:
Again I'd like to keep the in-memory data, for example interpolated samples

I I I I I I I I I I I I I I I I I I I I

and then replace a subsection with newly received 'raw' data when you zoom
in:

I I I I I r r r r r I I I I I I I I I I

But the interpolated samples also have interpolated time stamps.

After you do that for a while, zooming in here and there, you can get this:

r r r r I r r r r r I r r r I r r r r r

You have a lot of raw data that replaced the interpolated data, but some
interpolated samples remain because they're "in between" actual raw data.


Thanks,
-Kay
Attachment:
opt.png
Description: opt.png
Attachment:
orig.png
Description: orig.png
- References:
- Re: Inspect Samples of CSS shows inconsistent SEVR Burkhard Kolb
- Navigate by Date:
- Prev: devLib2 2.3 release Michael Davidsaver
- Next: Re: Doubt regarding Process Variable Eric Norum
- Index: 1994 1995 1996 1997 1998 1999 2000 2001 2002 2003 2004 2005 2006 2007 2008 2009 2010 2011 <2012> 2013 2014 2015 2016 2017 2018 2019 2020 2021 2022 2023 2024 2025 2026
- Navigate by Thread:
- Prev: Re: Inspect Samples of CSS shows inconsistent SEVR Burkhard Kolb
- Next: [db] simple command ? Pavel Masloff
- Index: 1994 1995 1996 1997 1998 1999 2000 2001 2002 2003 2004 2005 2006 2007 2008 2009 2010 2011 <2012> 2013 2014 2015 2016 2017 2018 2019 2020 2021 2022 2023 2024 2025 2026
· Distributions · Download · Documents · Links · Licensing ·